Marketplace category structure – test it

One of the most important things you have to do when you build a marketplace category structure - test it. Tree testing provides quantitative data and deep insights. The ease of product findability can be properly estimated, by looking at the time and number of attempts it took the users to find what they were looking for.
The article is a follow-up to Marketplace store category structure – do it right.
As discussed before, tree testing is a method for assessing the quality of a category structure. The process is rather simple, and requires preparing a category structure, and a list of items for users to locate within it. This method allows you to easily collect plenty of data from multiple users, but extracting useful insights and trends from the data requires a different approach.
How to Collect the Data
Know your users. As much as possible, the participants in the tree test need to represent the target market. This will allow you to collect more accurate and relevant data. For instance, don’t use make participants to test for women’s fashion.
The method used in tree testing gives you the opportunity to collect data from multiple users. The more participants in the test, the easier it will be to accurately identify patterns and trends in the data, so it is recommended you use at least 50 participants. In this instance, if you conduct a tree test to compare two different trees, you will need double this number, as each group tests a different tree.
Don’t burden the participants. It is important to keep the number of tasks the participants are asked to perform to a maximum of ten. Over burdening them with too many tasks might skew the test results. The reason for this is that users’ state of mind after going through the website 20 times is quite different from a user who has just arrived there for the first time. In case you need to test more than ten products, the preferred solution is to recruit more participants and randomize the product between them, noticing not to give each participant more than ten tasks.
Conduct a pilot run. Before sending out the tree test to the entire test group, we recommend sending out a pilot test to a few chosen participants. These pilot runs can help detect any problems, errors or misunderstanding early and fix them before conducting the actual test.
How to Analyze Results
There are several metrics by which the results are analyzed, describing how well the participants did in the tree test. Each task in the test is measured according to:
- Success rate - the percentage of participants who successfully completed the task (e.g. located the product within the correct category)
- Accuracy - the percentage of participants who managed to complete the task on the first go (e.g. managed to find the product in their first attempt)
- Time - the average time it took participants to complete the task
- Journey metrics:
- How many time each category was selected
- The category that was most participants’ initial selection for each task
- The category most participants finally selected
The significance of each of these metrics may vary according to what the tree test is focusing on. At times, more weight should be given to different metrics in evaluating the results.
Success Rate
Success rate measures the percentage of participants who successfully located the product in the correct category. To measure this, a correct answer must be assigned to each task in advance. Each time a participant selected the wrong category, this will be considered a failure. For instance, if 87 out of 100 participants were able to find the product in its correct category in a given task, the success rate is 87%.
Of course, the higher the success rate - the better, but in order to really gain something from this data, you must first decide on what counts for a good success rate, and what counts for an excellent success rate. This is true of both each individual task and the test itself.
It is important to note that in tree testing, the participants do not use or see any navigation elements that might exist in the website, such as a search bar or a navigation menu. The test presents participants only with a very simplified version of the navigation structure.

For this reason, success rates in tree testing may be lower than the success rate of tests conducted in the actual website, where participants have the benefits of navigation tools and better visuals.
When deciding on your success rate objective, two factors should be taken into consideration:
- How integral the test is to the overall user experience
- Comparison to success rates of similar tasks
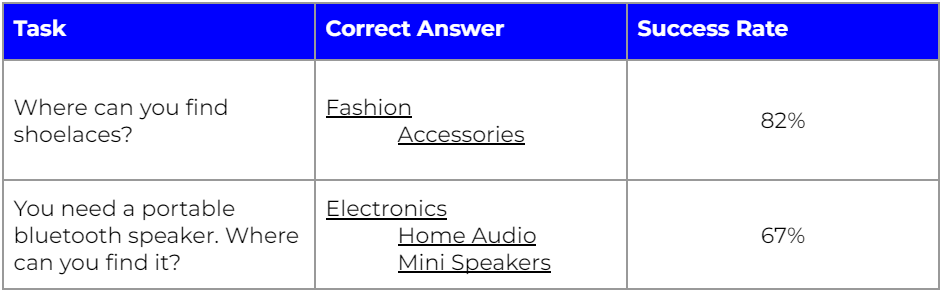
In this example, the success rate for shoelaces is much higher than for a portable speaker. But it is important to note that in order to reach the correct answer for the latter, they have to get one more level deep in the tree. Therefore, the two success rates are not exactly comparable.
It would be more efficient to compare the success rate of tasks that have a similar number of category levels, or alternatively, compare the success rate of the same task, only using different category labels, to see which one is clearer to users.
Accuracy and Time
The final result is not the only thing that matters. How the participants got there is no less important. The two metrics that measure this are time, or how fast did participants complete the task, and accuracy, which reflects the number of participants who completed the task correctly in their first attempt, without switching categories half way.
It is completely possible for a task to have a high success rate, but very poor accuracy. If categories are not properly structured, users might have to scour the website in order to find what they were looking for. Even when they eventually find it, the road there has been too long, and the accuracy poor.
Both metrics - time and accuracy - reflect how well participants handled the task, other than the eventual success rate.
Conclusion
When creating marketplace category structure - test it to ensure performance. Tree testing provides us mainly with quantitative data, but there are insights to be gained from the numbers. Success rates are a good indicator, but they must be examined in the context of how easy it was for users to complete the task, by looking at the time and attempts it took.
After analyzing the results with the proper context, you can begin making adjustments to the category tree accordingly.